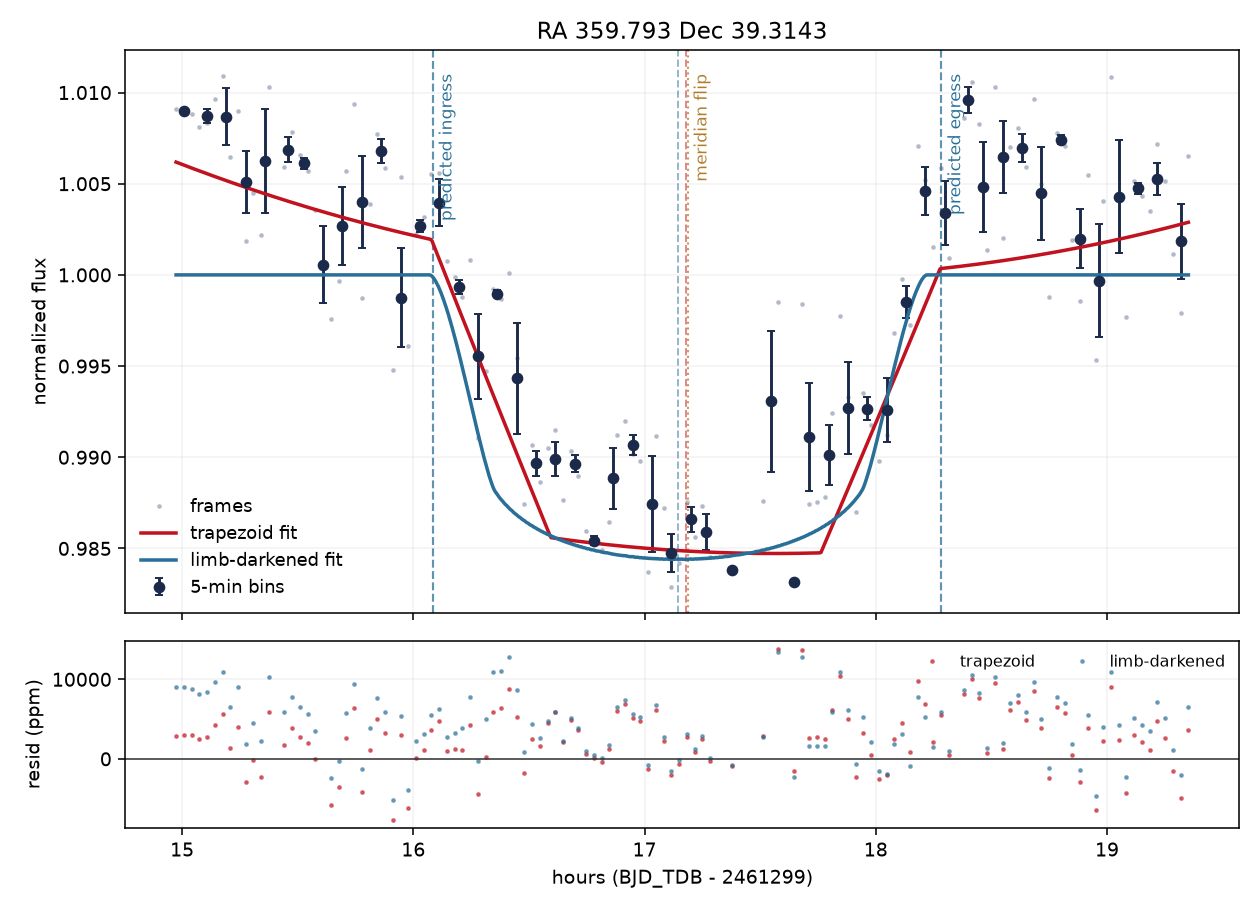
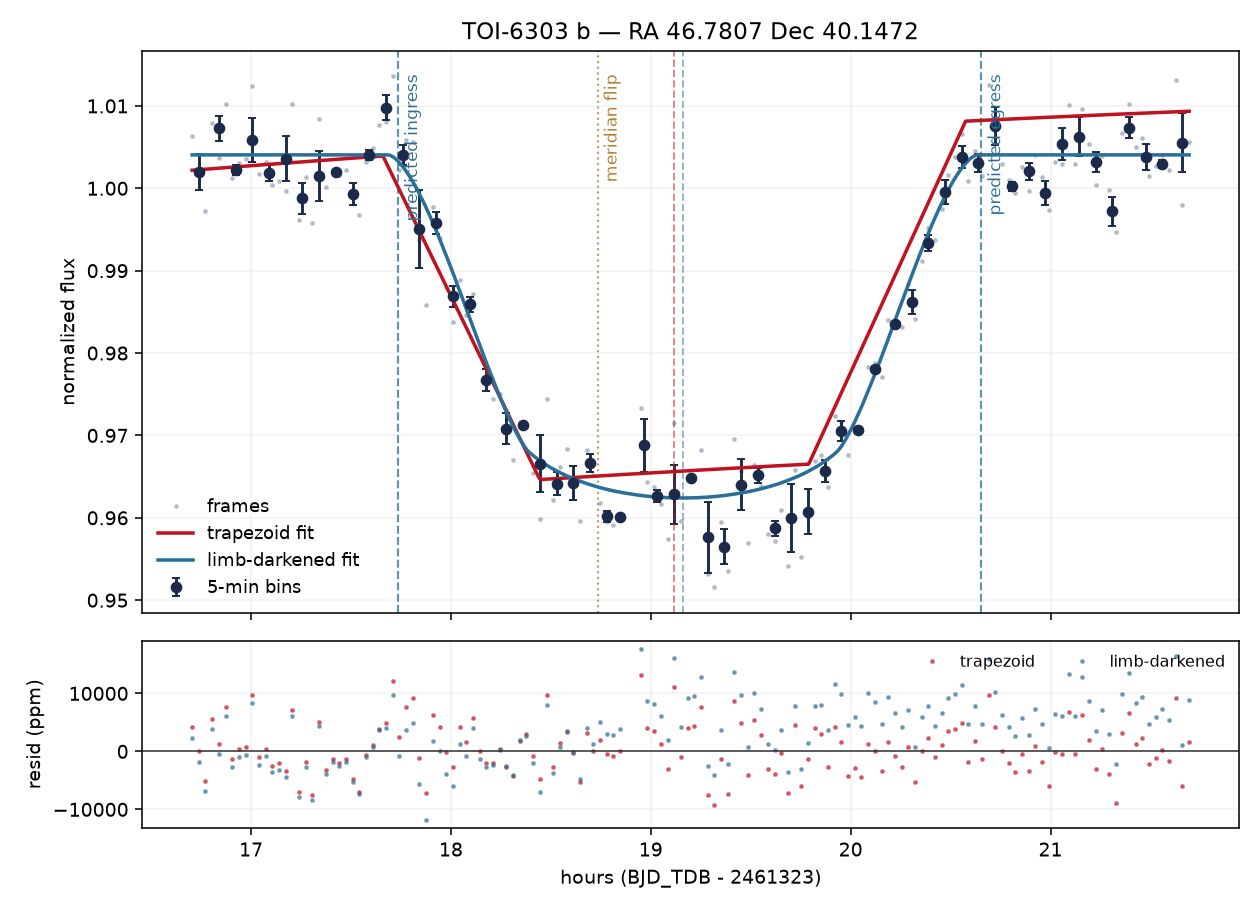
How a transit light curve works
When an exoplanet passes in front of its host star, a small fraction of the starlight is blocked. Plotting the star’s brightness over time produces the characteristic “dip” — the transit light curve.
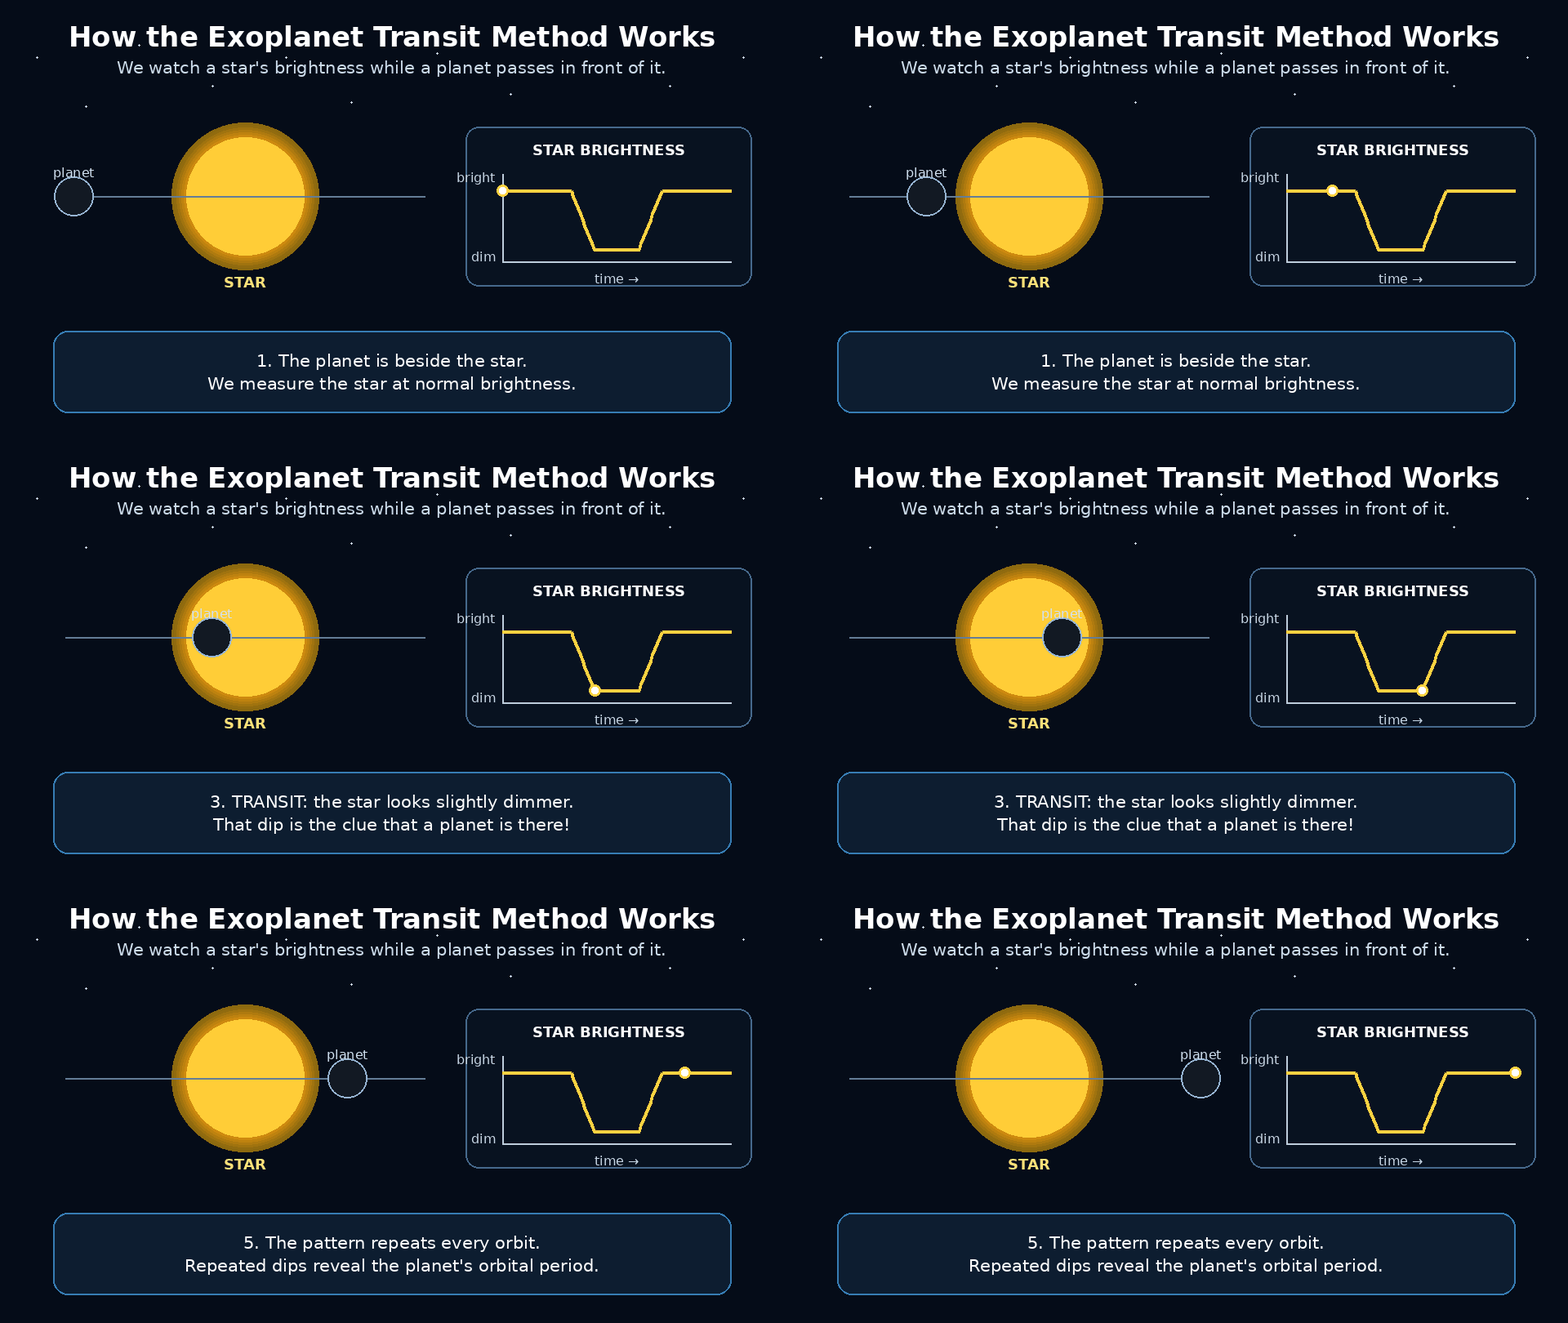
Tracking the subtle dips in starlight that reveal distant worlds. Each plot shows normalized flux, model fits, and residuals.
The light curves below were planned with TransitPlanner ((transits.justinlutz.com) and the data was processed with TransitPlanner Processor.